
Is there anything better than going to a Major League ballpark cheering for your favourite team with a hotdog in one hand and a nice cold beverage in the other? Probably not.
While Baseball is one of the slowest pace sports, the tension and excitement of each pitch and each swing of the bat will keep you on the edge of your seat. With one swing, the game’s whole complexion could change.
It is no secret that Baseball is a numbers game, but there’s a lot more that goes into the game than the standard stats you see in the sports section of the morning newspaper.
The Importance of Baseball Stats
Regarding numbers and statistics, Baseball is king. Over the last ten years, baseball analytics has become increasingly popular. You could call this the “Money Ball” approach that Oakland Athletics General Manager Billy Beane introduced in the early 2000s.
Bill James, one of the leading fathers of baseball analytics or Sabermetrics, expanded on the general or more traditional baseball stats like batting average.
For example, a traditional way to measure batting performance is through players batting average, which is calculated by taking the number of hits by a player and dividing it by that player’s at-bats. Bill James found a flaw because the batting average ignores other ways a player can reach base, like walks or hit-by-pitch.
He then created an on-base percentage that takes walks and hit-by-pitches into consideration. To calculate the On-Base rate, take the total number of hits + bases on balls + hit-by-pitch, then divide by at-bats + bases on balls + hit-by-pitch + sacrifice flies.
The importance of advanced stats and analytics helps with the predictive performance of players on the field and helps us gain a slight edge when betting on Baseball.
Betting on Baseball can be very overwhelming. There is much information on the internet, plus the 8-14 games daily throughout a six-month season. It is a lot to take in.
With the information we provide you and researching some of the best offshore betting sites, you will have no problem betting on Baseball shortly.
Below we will go through some essential stats regarding betting on Baseball.
wOBA
wOBA (Weighted On-base Average) is similar to on-base percentage, but instead of considering whether or not a player gets on base, it accounts for how a player got on base. The value for each event directly correlates with the projected runs scored from that event. For example, a triple would be worth more than a double when calculating wOBA.
In 2021, the wOBA leader was the National League MVP, Bryce Harper, at .431. An average MLB player can expect to rack up a wOBA of .320.
In 2021, as a team, the Toronto Blue Jays led the MLB in wOBA at .340. The two World Series participants, Atlanta Braves, had a wOBA of .323 (7th best). Houston Astros had a wOBA of .363 (2nd best)
wRC+
wRC+, per Fangraphs, is a rate statistic that attempts to credit a hitter for the value of each outcome (single, double, etc.) rather than treating all hits the same while also controlling for park effects. wRC+ is a better tool for finding mean value than the traditional batting average, RBI and OPS stats.
The league-average wRC+ sits at 100, so a player who notches a wRC+ of 150 would be 50% above the league average.
Similarly, a player with a wRC+ of 80 created 20% fewer runs than the league average.
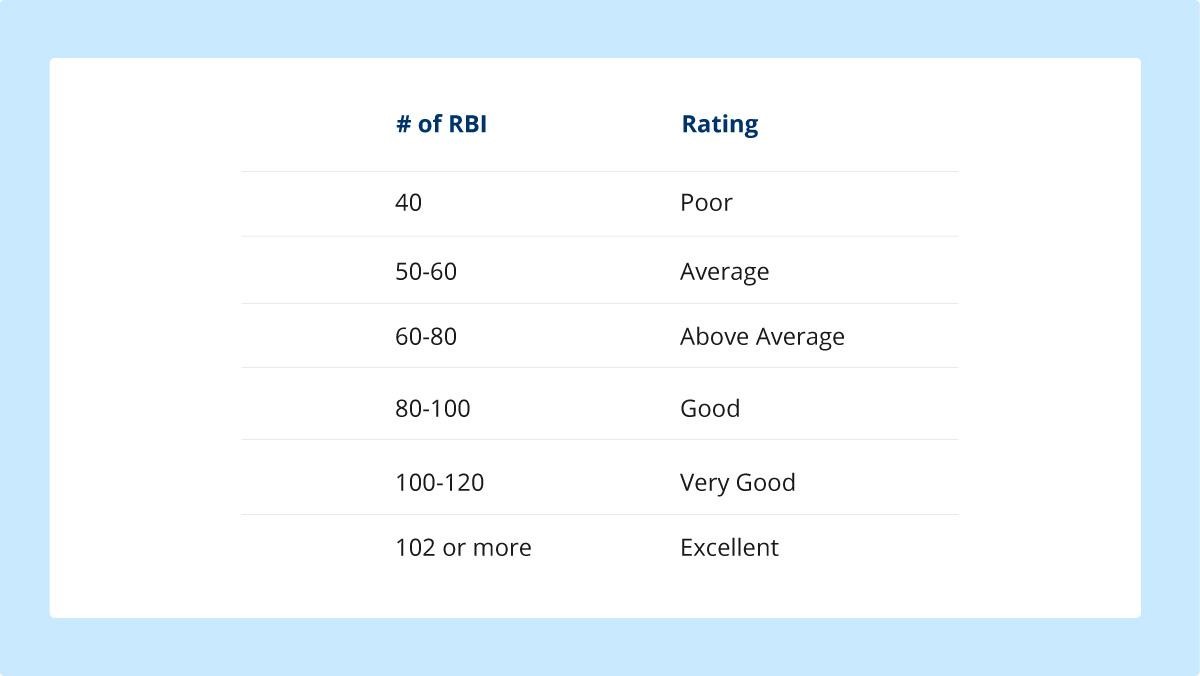
RBI
RBI, or Runs Batted In, is one of the most recognizable stats in Baseball. A player receives an RBI when his plate appearance results in a run scored.
For example, if there are runners on 2nd and 3rd and the hitter hits a single, and both runners score, that is two RBIs.
Or, in the batter, it’s a solo home run; he is the only one to score and, therefore, gets one RBI.
A player does not receive an RBI when the run scores due to an error or ground into a double play.
BaseRuns
BaseRuns estimate how many runs a team would expect to score (or allow) given their underlying offensive (or defensive) performance.
BaseRuns is more of a statistic to measure a team rather than an individual player. It can also help you understand which teams are scoring/allowing more/fewer runs than you might expect, given their raw offensive/defensive numbers.
FIP & xFIP
FIP (Fielding Independent Pitching)
It measures a pitcher’s mound performance and reads like ERA. FIP, however, only includes events that pitchers have control over, such as strikeouts, walks, home runs, and hit-by-pitches.
A pitcher’s ERA would look FIP measures if he experienced league-average defence and luck.
xFIP (Expected Fielding Independent Pitching)
xFIP serves as a better indicator of a pitcher’s ability moving forward than ERA like FIP, but the two stats differ in how they track home runs.
While FIP uses the total number of home runs allowed in its equation, xFIP uses the home run rate.
From a betting perspective, FIP and xFIP can be incredibly useful when isolating a pitcher’s underlying performance to find value game-to-game.
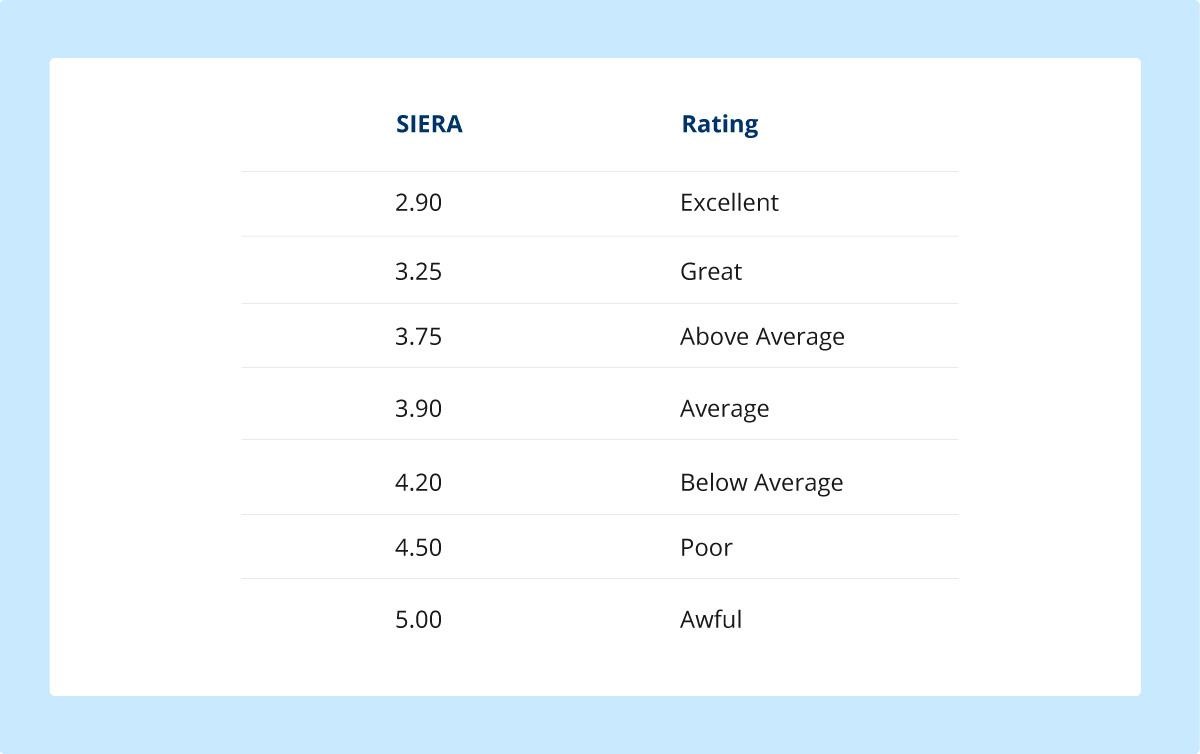
Siera
Skill-Interactive ERA (SIERA). Siera is another pitching stat that stems from ERA. SIERA measures a pitcher’s performance by trying to eliminate factors the pitcher can’t control by himself. Unlike xFIP, SIERA considers balls in play and adjusts for the type in play.
SIERA is slightly more predictive than FIP and xFIP; it also explains the “how” and “why” a pitcher is good or bad.
With the understanding of these seven stats, you should now be able to find value in teams or players. Use this knowledge to find mismatches during the MLB season, and hopefully, you can make a little bit of money.